Look, Ma, No More Mercator Tiles
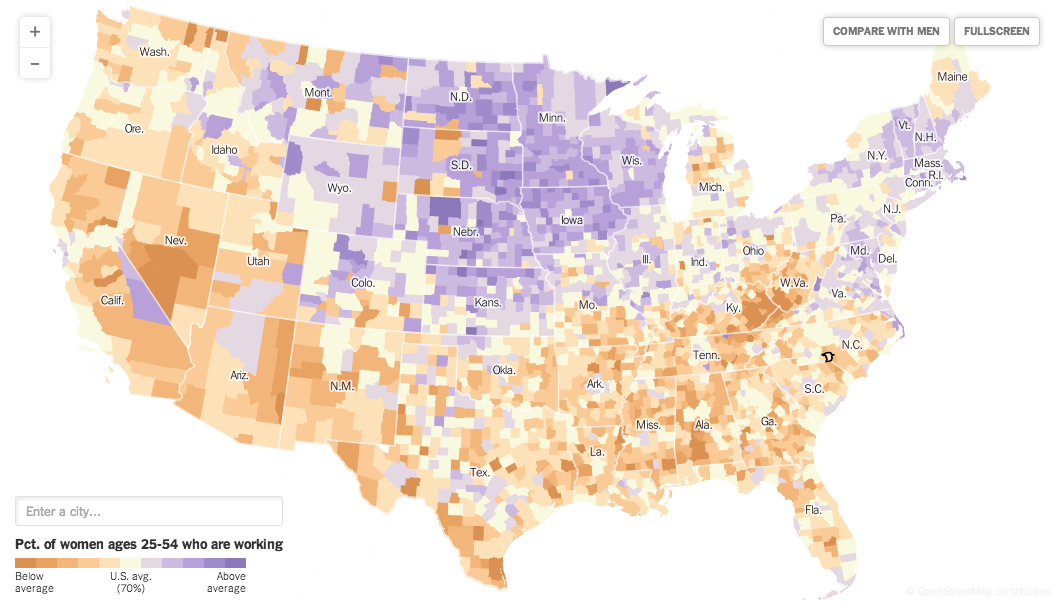
Using open source tools it is now super easy to make your own map tiles, and with a little extra work you can render them in whatever map projection you want. No more excuses to use Mercator! For example, here is a map we published today at The Upshot. It shows where prime-age women are working more or less then average, and includes data from county-level in the overview map down to every census tract once you zoom in. And all is nicely projected in Albers Equal-Area Conic, a projection widely adopted as standard for U.S. maps.
So how does this work?
After many years of blindly accepting the dominance of Web Mercator tile maps, I was quite surprised to learn how easy it is to use whatever projection you want. So how does this work? The answer is that it works because Mapnik, the core of many open source tile mapping frameworks, supports custom projections out of the box. It is just the tools built around Mapnik that are not supporting other projections. Tilemill, for instance, is a super nice tool for styling map tiles in a CSS like language. But if you export your map as tiles using Tilemill, you are stuck with Web Mercator, even though internally it is Mapnik that renders all the tiles. Fortunately this doesn’t mean that you have to deal with Mapnik and it’s quirks directly to get custom projections.
Step 1: Export Mapnik XML and change projection
So the first step is to style your map just as you would with a Mercator map, enjoying the full feature-set of Tilemill. Once you’rd done with that you export your project as Mapnik XML. Think of this XML file as the entire description of your map. It contains all the references to the source layers and all the styles for the map features — in one single file. If you actually read the code of the file you will quickly realize how extremely lucky we are to have Tilemill and CartoCSS. And you might also notice that in the root element of the document, named <Map>, you find the the definition of the map projection as Proj.4 string in the srs attribute (for spatial reference system). And you can simply change it to whatever you want. In this case I replaced the Mercator projection with the Albers projection (copied from the Proj.4 definition linked here):
    <Map srs="+proj=aea +lat_1=29.5 +lat_2=45.5
       +lat_0=37.5 +lon_0=-96 +x_0=0 +y_0=0 +ellps=sphere
       +towgs84=0,0,0,0,0,0,0 +units=m +no_defs +nadgrids=@null"
       background-color="#ffffff">
I copied the Proj.4 string from spatialreference.org, where you find many other standard projections as well. (Hint: If you plan on aligning the tile map to a D3.js projected vector overlay you should append +nadgrids=@null to the Proj.4 string) To preview the projection I used TileStache. All it needs is a JSON configuration file that points to the exported Mapnik XML as input layer.
{
	"cache": {
		"name": "Disk",
		"path": "tiles"
	},
	"layers": {
		"map": {
			"provider": { "name": "mapnik", "mapfile": "mapnik.xml" },
			"projection": "spherical mercator"
		}
	}
}
Then you run tilestache-server.py with your config and open http://localhost:8080/map/preview.html to preview the freshly rendered projected tiles, just as you would in Tilemill.
Step 2: Figuring out which tiles to render
Now we come to the first tricky part of the process. We need to figure out which tiles we actually want to be rendered. You probably already know the zoom levels and the bounding box in WGS 84 lat/lon coordinates, but the latter won’t help us much since TileStache is designed for rectangular projections like Mercator. Fortunately TileStache also takes a text file with a list of Z/X/Y tile coordinates as input. To get this list of tiles I wrote a Python script (feel free to re-use if you want). The script uses mercantile, a Python library for tile calculations, which returns the tile coordinates for points in WGS84 lat/lon, assuming that the tiles are projected in Web Mercator. To trick the library into giving me the correct tiles, I converted the points to the custom projection first and then projected them “back” from Web Mercator (even though the coordinates aren’t in Mercator). When mercantile gets my “fake” lat/lon coordinates it projects them to Mercator (reversing my inverse projection) and ends up with the Albers Equal Area coordinates.
    def get_tile(lon, lat, z):
        # project to custom projection
        pt = albers(lon, lat)
        # project "back" from Mercator
        pt2 = mercator(pt[0], pt[1], inverse=True)
        return mercantile.tile(pt2[0],pt2[1], z)
Using this function I then compute the top-left and bottom-right tile for each zoom level and add every tile in between the two to my tile list. 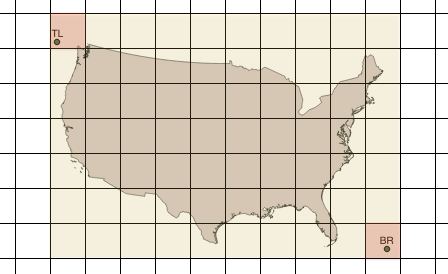 The bounding box coordinates deserve a further note. Bounding boxes cannot be projected between non-rectangular coordinate systems. Here is an example showing a lat/lon bounding box that works fine in Mercator, projected to the Albers projection. Not only do we get too much empty space but we’re also missing significant parts of U.S. territory.
 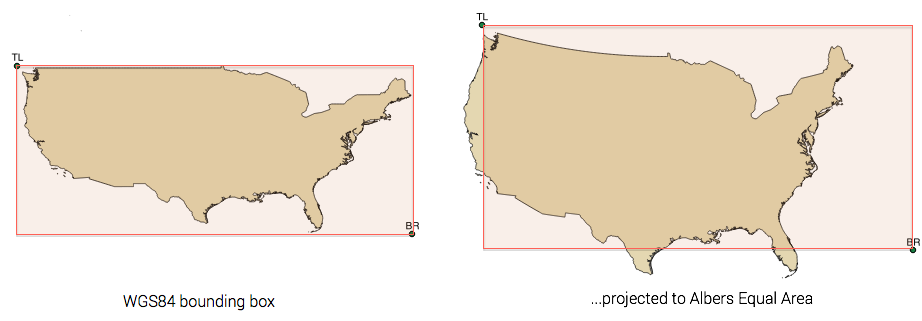 So instead we have to do the reverse approach and grab the Albers bounding box and then project it back to WGS 84 lat/lon (I used QGIS for this step). This bounding box I then used in the Python script to generate the tile urls.
 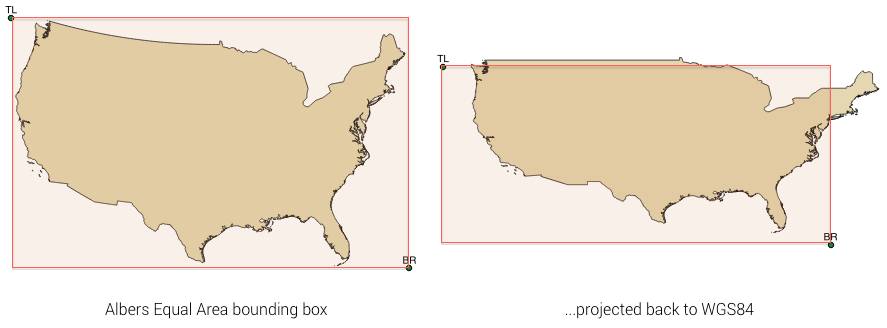 Finally we run
 tilestache-seed.py to pre-generate all the tiles in our list (you probably want to host them as static files somewhere), which may or may not take quite a while to finish.
python make-tile-urls.py
tilestache-seed.py -c config.json --tile-list=tile-urls.txt --layer=map
Step 3: Translating coordinates in web map
Once we generated all our tiles we almost made it to the end. The tiles can be used just like Mercator tiles, so you are free to pick your favorite tilemap framework such as Leaflet.js, Polymaps, OpenLayers or whatever you prefer. For our women employment map I went with ModestMaps which I like for its simplicity and “hackability”. However, all of these frameworks assume that your tiles are in Mercator projection, so the built-in conversion from WGS 84 lat/lon to Mercator tile coordinates won’t work for us — unless we do the same trick I showed above. First, we are going to need the two projections Web Mercator and Albers, which you find in the Proj.4 JavaScript fork. Needless to say that you should use the exact same projection definition here.
// Web Mercator
var mercator = proj4(
		'+proj=merc +a=6378137 +b=6378137 +lat_ts=0.0 +lon_0=0.0 ' +
			'+x_0=0.0 +y_0=0 +k=1.0 +units=m +nadgrids=@null +wktext ' +
			'+over +no_defs'
	),
	// Albers Equal Area
	albers = proj4(
		'+proj=aea +lat_1=29.5 +lat_2=45.5 +lat_0=37.5 +lon_0=-96 ' +
			'+x_0=0 +y_0=0 +ellps=sphere +nadgrids=@null ' +
			'+towgs84=0,0,0,0,0,0,0 +units=m +no_defs'
	);
Using these projection classes we can convert coordinates from the ‘real’ WGS 84 lat/lon coordinates to the ‘wrong’ lat/lon coordinates on our map, by first projecting to Albers, and then inverse projecting “back” from Web Mercator.
function WGS84ToMap(pt) {
	pt = mercator.inverse(albers.forward([pt.lon, pt.lat]));
	return { lon: pt[0], lat: pt[1] };
}
The same works in the reverse direction, too. I used this to display the current map coordinates in the URL hash, simply by passing the map center (the ‘wrong’ coordinates I get from map.getCenter()) to mapToWGS84().
function mapToWGS84(pt) {
	pt = albers.inverse(mercator.forward([pt.lon, pt.lat]));
	return { lon: pt[0], lat: pt[1] };
}
And that’s basically all it needed to get the tile map library working with my custom projected tiles. Of course there is a lot more I could write about (and I will in future posts), but for now, let’s wrap this up: Making tile maps using custom projections isn’t that hard, and the beautiful maps are definitely worth it. You can use Tilemill just as usual, export Mapnik XML, change the projection in the XML and then render the tiles using TileStache. You can use these tiles in any tile map framework, but you have to convert coordinates from and to your ‘wrong’ lat/lons. If you have further questions or know a different approach for tile maps in custom projections, let us know in the comment section. Also, if you happen to work at Mapbox or another company that produces tile map tools with a built-in limitation to rectangular projections, I would be curious to hear why you’re not willing to go the extra mile for the sake of beautiful maps. And in case you find this blog post helpful, please tweet it! :)
Comments
Hannes (Jan 07, 2015)
You should be able to find lots of software in/from the geo world, rather than the JS world, that was designed with support for any projection in mind. OpenLayers can handle any projection, there also is a Proj4 plugin for Leaflet. There are standards like TMS or WMS variants. This might make it all easier and less “through the backdoor”. ;)
Seeing web mercator being used for everything, just because some software dictated or suggested it, is painful for people with a cartographic background.
Gregor (Jan 07, 2015)
Indeed. I saw that OpenLayers can deal with projections and that there is a Leaflet Plugin for Proj4. I guess I partly wrote this post to convince maintainers of Mercator-bound geo software to consider adding support for custom projected tiles. The coordinate transformation should really be part of the frameworks, and not of the map code.
Calvin (Jan 07, 2015)
Jason Davies’ work on projected tiles is pretty good and avoids the pitfall your solution has which is interoperability, the reason for using mercator tiles is because thats that the other tiles are in and for most maps it’s good enough.
Gregor (Jan 07, 2015)
Yeah, I know his work on projected tiles. It’s a nice trick, but it wouldn’t work in a real use case as the map labels get rotated and look blurry. You want crisp and horizontally aligned text on a map, right?
s (Jan 07, 2015)
Why not simply use a d3 projection for your project? I see no need for tiles.
Gregor (Jan 07, 2015)
Ha, I’m curious to hear how you would render this detail view of NYC just using D3.
http://new.tinygrab.com/f3aa221ede71c30897f1a0998015ed988375dffdfc.png
At the very least you would need vector tiles instead of image tiles, since the streets alone are several gigabytes.
Steven Romalewski (Jan 08, 2015)
This is a helpful post. But following on Calvin’s comment, hasn’t the sole reason for using the Web Mercator projection been so you can overlay tiles on now-ubiquitous basemaps such as Google’s?
I agree that we shouldn’t “blindly accept” the web Mercator projection, but there’s a reason for it, whether it’s a good reason or not. I thought it would have made your post stronger if you had stated that obvious but perhaps overlooked point.
In other words, it wasn’t like we all just woke up yesterday and realized that we should be making maps in other projections. There are thousands of map projections/coordinate systems that have been used for decades (centuries?), each with a particular purpose and/or location in mind.
But if you want to easily overlay your choropleth or other map layers on a pre-rendered basemap, for now there’s Google, Bing, MapQuest, and OSM and its variants. And those are all web Mercator.
Noticeably the Times’s map in your blog post (which is very nice, btw) does not have much of a basemap other than neighborhood labels and streets. True, you could argue that it doesn’t need any more than that. But for now, if you don’t use web Mercator, you can’t use an “off-the-shelf” basemap - you’d need to create your own in the same custom projection, not necessarily a trivial task.
Anyway, you’re right that “making tile maps using custom projections” isn’t complicated. But I thought the reason why we’ve all been using web Mercator should’ve been pointed out. And it’d be nice if we could overlay non-web Mercator tiles on the now-standard basemaps (or, better yet, reproject those pre-rendered basemaps on the fly). But maybe not being able to do that is (one of) the price(s) we’ve been paying for these otherwise “free” services.
Tom (Jan 08, 2015)
Okay, I’ll bite.
Reasons why Mapbox doesn’t support non-Mercator projections (yet):
Projection definitions are stuck in the 80s: you have to look up some string defining a projection and copy and paste it from place to place, or rely on a shorthand to that string and hope that it’s the right shorthand and you have the right CSV of projections stashed somewhere on your computer.
This is a fixable problem, but currently no-one has the technical and political skills to do it as well as a good reason to spend a lot of time on it.
Next: “compatibility over the internet”: the sort of problem for which other technology has the html ‘lang’ attribute and magic numbers in binary files and so on. There is nothing for this: having Leaflet know what projection a layer is in, without copying and pasting JavaScript or some hopefully-accurate proj4 string is just not a reality.
Which brings us to the user expectation that layered maps should work. Back in the day, I worked with OpenLayers, which offered glorious projection support: really, it had gone all-in on making everything projection-related possible, though not easy. And this was the cause of a tremendous percentage of all support: it is a reasonable expectation that you can combine map layers of different projections and it’ll work, but it can’t. Tiles are baked images and they are baked in projections, never to be warped without significant artifacting (see MapProxy).
So, metadata doesn’t exist, user expectations are not set, finally tiling. Virtually all tiled sources use the OSM “XYZ” tiling scheme, which is only defined for Spherical Mercator and, for each other projection, is a big question mark. Schemes that try to resolve this, like WMTS, have fallen into the overstandardized complexity gotcha, with each projection also having sort of meta-choices around exactly where you want to slice and how. They’re too big to be popular, when XYZ tiles are so simple a novice coder can write a tiling client.
Which brings us to vector tiles. The popular conception of vector tiles is that they’re “just vector data” and thus all further choices are free. Unfortunately, this isn’t true: vector tiles are tiles, and to be efficient they need to be simplified. An efficient simplification is perceptual, so they’re simplified to the tiling scheme, which is - you guessed it - Spherical Mercator. A bummer, but the upside is that dynamic reprojection of vector tiles has radically less distortion than reprojection of raster tiles, so it is a big win.
I hope this clears up some of the rationale for why this isn’t easy to do technically. I’ll close with two quick non-technical notes:
Firstly: demand for non-Mercator projections is a high-level user request from people who are really into cartography. Projections are invisible for the vast majority of developers, designers, and consumers. And for people who are into cartography but also need a different dimension - like tons of data or easy compatibility with non-Leaflet APIs - the complexity disadvantages of custom projections outweigh the wins, fast.
The problem here is that, while this was doable for you, it consisted of four technical steps that all have decisions baked in - decisions that you can make and you can accept at each level. You made the map, you know it’s in a projection, you can configure Leaflet and know that it isn’t going to work with a different tile layer, or a map you make in a different projection. The problem that a larger system (eg Mapbox) would have to solve is to make a general solution for each of these steps, as well as all of the bumpers to make this less of a usability nightmare: how do you use this map in iOS? In GL? If you have related information to geocode from, is the vector tile data projected as well? Or not projected, in a separate tileset?
Paul Ramsey (Jan 08, 2015)
Agree w/ everything except the metadata argument at the top. OGC WKT for SRS is “good enough” to represent all kinds of projections in a nice standard way, and even includes niceties like spheroid/datum handling (which proj is more flakey about). And handling it is a solved problem. Death to ESPG codes.
Matthew (Jan 08, 2015)
The cartographic argument for non-Mercator maps is compelling - I too like looking at maps in other projections - but I think it’s a fair point that, if all you’re doing is plotting some data on a map, the interop advantages to Mercator are worth the compromise.
> Projections are invisible for the vast majority of developers…
For anything beyond simply dumping your data on a map, that’s precisely the problem. Sweeping the complexity of projections under the rug and saying “look how easy this is now” is not a solution. Projections fundamentally alter the results of geospatial analyses; they are a necessary and fundamental core concept, an absolute prerequisite to doing anything with geographic data.
Any analysis with spatial relationships, area, distance, direction and geometric overlays are compromised if you are working in the wrong projection. I can’t wait to see what stupid mistakes arise “doing GIS” in javascript without consideration for projections.
Tom (Jan 08, 2015)
This is a discussion of output in projections for display. This is entirely separate to how data is stored, or in which projection it is processed - I don’t see how jabs at ‘GIS in JavaScript’ are relevant. Nobody stores their raw data in ‘mercator’ and nobody’s suggesting that.
Matthew (Jan 08, 2015)
Yeah sorry, the jab at “GIS in Javascript” was unnecessary. It’s more a jab at the general idea that you can do anything significant with geographic data without consideration for projections. You can’t sweep it under the rug: projections have real implications for storing, analyzing and displaying any geographic data. The “it doesn’t matter, just use Mercator” approach is not ultimately helpful to the geospatial developer community.
Gregor (Jan 08, 2015)
Btw, Mike just pointed me to this demonstration of streets rendered from vector tiles in D3: http://bl.ocks.org/mbostock/5593150
Tom (Jan 08, 2015)
Then we’re in agreement: it is extremely important to know about geographic data in depth if you’re going to analyze it. The difference between projections in data and in output is important: nobody’s should do their analysis in web mercator. The output of their analysis on a web mercator map is a totally different concern.
And I don’t mean to belittle projections in general: they are useful and interesting, and for some analysis, mercator really doesn’t cut it (mostly for the arctic). I think in a lot of cases, mercator does cut it: a person doing a scaled-point map in their small American city shouldn’t spend an hour choosing their projection, just like you shouldn’t spend a bunch of time choosing fonts in your school essays: that’s a distraction.
But it is important to understand why mercator is the default in so many places and the technical issues surrounding it. That’s the only way we can really grasp what’s on the todo list to make custom output projections less of a technical gotcha.
Gregor (Jan 08, 2015)
Tom, thanks so much for helping us to understand this.
I agree, once you’re at the point where you want to combine different map layers you get into big trouble. And while I can see why Mapbox is not investing more resources into this feature, there are still a few (simple) things that could significantly help making custom projected tiles in Tilemill:
- Allowing to set the projection per project and simply passing it on to Mapnik. If I can preview maps in custom projections easily in TileStache, this should work in Tilemill, too. This could be a feature marked as ‘experimental’ with big warning signs to keep away less ‘high-level’ users.
- It would be nice if Tilemill could export separate Mapnik XML styles for Retina tiles. I found a way to do this using a global @scale variable to rescale line withs and font sizes, and shifting the zoom level.
- Finally, Tilemill could also allow exporting tiles in custom projection, essentially just by letting Mapnik do it’s job. Then end-users like me would not need to use TileStache.
Maybe I try hacking this into Tilemill one day..
Bill (Jan 08, 2015)
Gregor, I’m probably oversimplifying for your specific use case, but I’ve always found it easy enough to use custom projections in Tilemill without resorting to the Mapnik XML or a custom tile server. By lying to Tilemill when loading layers (“Why yes, computer friend, this shapefile IS in EPSG:900913!”), you can render in Albers US, then bake the tiles to mapbox hosting or chop them up with mbutil for static serving. The only downside is the obviously-incorrect internal geolocation (note the hash).
Friedrich Hartmann (Jan 09, 2015)
First I want to point out that Spherical Mercator still excels for global coverage of raster data to be viewed at small scales (street level to region) due to it’s conformal properties. It’s just ill-suited for continental to global map view extents.
And since, in the past, clients were only meant to stitch image tiles back together the tiling was inherently linked to the map projection since all the labels were already baked in and distorting them by means of reprojection simply would make things look not as nice as they should be.
This problem and limitation is avoidable in client side rendering of vector data as stated here before, the hard dependency between the geo data’s coordinate system and the displayed map projection is not in existence anymore. So why keep the old tiling schemes? Projection definitions are definitely not the problem here, neither are they stuck in the 80’s nor are they inherently hard to understand, especially the so called geometric projections. Also there is the need to be made a distinction between the data’s geographic coordinate system and Datum (WGS84, NAD83) and projected coordinate systems like UTM called coordinate reference systems (CRS), these all are different beast. The part that is responsible for the complexity of the CRS string is not the projection it’s the arbitrary definition of the different coordinate systems and the transformation between them.
I see it as eventually inevitable to adopt a better tiling scheme for global vector data than an equirectangular or Mercator grid. They both have at least some major drawbacks, compared to better suited hierarchical geodesic grids. One is being not equal area, which means an uneven number of calls and different amount of area coverage per tile based on latitude of the tile at the same scale. Where the equirectangular grid merely has two singularities, the spherical Mercator square has no coverage at all, at the poles beyond 85°, which disqualifies it as a global all purpose tiling scheme all together. An improvement would be to replace the usual rectangular data tiling with something more appropriate for the type of data we’re dealing with here, which are in the end points on an ellipsoid or sphere; in most cases a sphere will do.
There exist some not too complex alternatives like the Icosahedron Snyder Equal Area (ISEA) grid or HEALPix, which is well established and has quite solid support and libraries around it in the astronomical community (check out TPZF/GlobWeb on GitHub). Another benefit of having an equal area grid is being able to make statistical comparison between tiles on the same hierarchy level, like nodes per km², which is not dorictly possible in the current grids used for vector map tiles.
Doing the server side generalization within the projected CRS of the geodesic grid tiles would further harmonize the level of generalization across the globe, generalizing in equirectangular Cartesian space is a bad idea to begin with.
To sum up, I strongly recommend adopting a geodesic grid based tiling scheme for vector based maps.
Aaron Dennis (Jan 09, 2015)
I hate looking at the whole US in web mercator, too, but I find it equally unattractive to see zoomed in versions of the states on the east and west coasts that are tilted because the central meridian of their Albers projection is a thousand miles away.
Beyond interoperability with other web maps, Mercator is actually great at preserving local angles. If you want a map that let’s you zoom to any place and scale in the country, Mercator might be the best choice.
It seems the solution might be vector tiles projected “on the fly.” We’ll probably get there, but Mercator does okay for now.
Gregor (Jan 09, 2015)
I could hold against your argument that (1) the idea of North direction showing up is a rather artificial concept anyway and that (2) this wouldn’t be the first map where North is not showing up and also that (3) North being exactly up isn’t a really important feature of a map unless you looking for shortest way to the North pole — but still I can see your point. Especially when you look at Alaska and Hawaii, which are shown equal-area but ‘rotated’ to an unfortunate degree.
Still better than Mercator in the full U.S. view. Guess next time I switch from Albers to Mercator tiles at some zoom level.
Friedrich Hartmann (Jan 10, 2015)
Albers also preservers angles within and around it’s standard parallels very well. And Lambert conformal conic projection even preserves them everywhere. It’s basically the same as Mercator but using a cylinder as projective Surface.
For interactive maps there is even the possibility to have dynamic projection parameters based on the active view scale. While this is hard to realize for raster tile maps (no smooth transitions feasible due to fixed number of zoom scales), it’s quite realistic to do this for vector based ones. Continental view would be Lambert, as you zoom in it’s being gradually transitioned into Mercator, by interpolating between the two projections, this way it’s even directly compatible with raster tiles on higher zoom levels.
http://cartography.oregonstate.edu/ScaleAdaptiveWebMapProjections.html
Jamie Robertson (Mar 20, 2015)
Great Post! I’ve been working on my own tiles and they are working great in the tilestache previewer. I’m struggling with getting the last few functions you noted in step 3 to work with leaflet. Do you happen to have some example code for that, or with modestmaps? Thanks!
Chris (Jan 16, 2015)
Saw this a bit late but thought i’d add a few notes that might be helpful to those who want to try using different projections in web maps.
As others have already hinted for a zoomable map in conic projection Lambert is probably a better choice than Albers, for a whole country map showing statistical quantities the equal-area property might be considered more important of course.
The most difficulties arise when your projection includes one of the poles or the 180 degree meridian. Then you nearly always run into issues resulting in artefacts of some kind that require some more work than just setting the projection in your software.
And finally when you are advocating Mercator keep in mind that you cannot show the whole world in Mercator, web maps are cut off at 85 degrees and are often unusable beyond about 75 degrees since map styling is way off with regards to scale then. This does not mean it cannot work great for other parts of the planet of course. But while for lower latitudes use of other projections is just often better and nicer for polar regions it is essential.